At times, it is useful to print a Chart on Prescription in case of chronic patients. Patients who want regular monitoring of their Blood Pressure, Sugar Levels, Weight, SPO2, Height, Growth Charts feel comfortable to see a charted view of their readings along with the Prescription.
Here we show you how to generate a prescription using Charts in the Windows version.
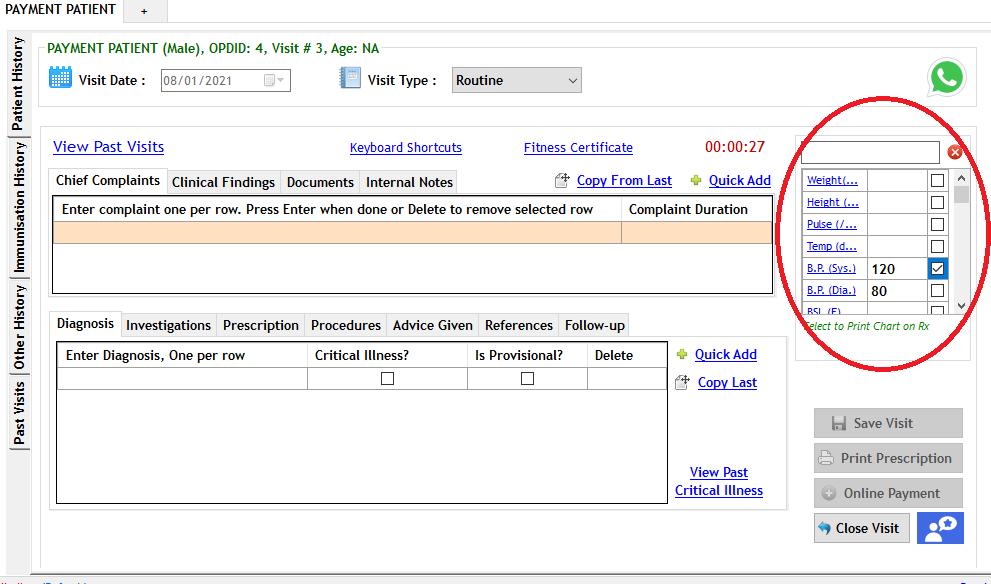
- Open the patient visit View where you make entries for Complaints, Clinical Findings etc. It will look something like below

- Check the circled portion. It is the part where you can enter Vitals and important investigation parameters. In the example above, we have entered Blood Pressure values and selected the Charting checkbox besides it. When the checkbox is selected, charts will be printed.
- MyOPD allows you to print two charts on a Prescription at the same time. Blood Pressure, Systolic and Diastolic, are considered as 1 chart so are Sugar Levels like Fasting and PP.
- This way, you can include Blood Pressure and Sugar Level charts side by side in the Rx.
- This is how a chart on Rx would look like when printed

It is really that simple!


